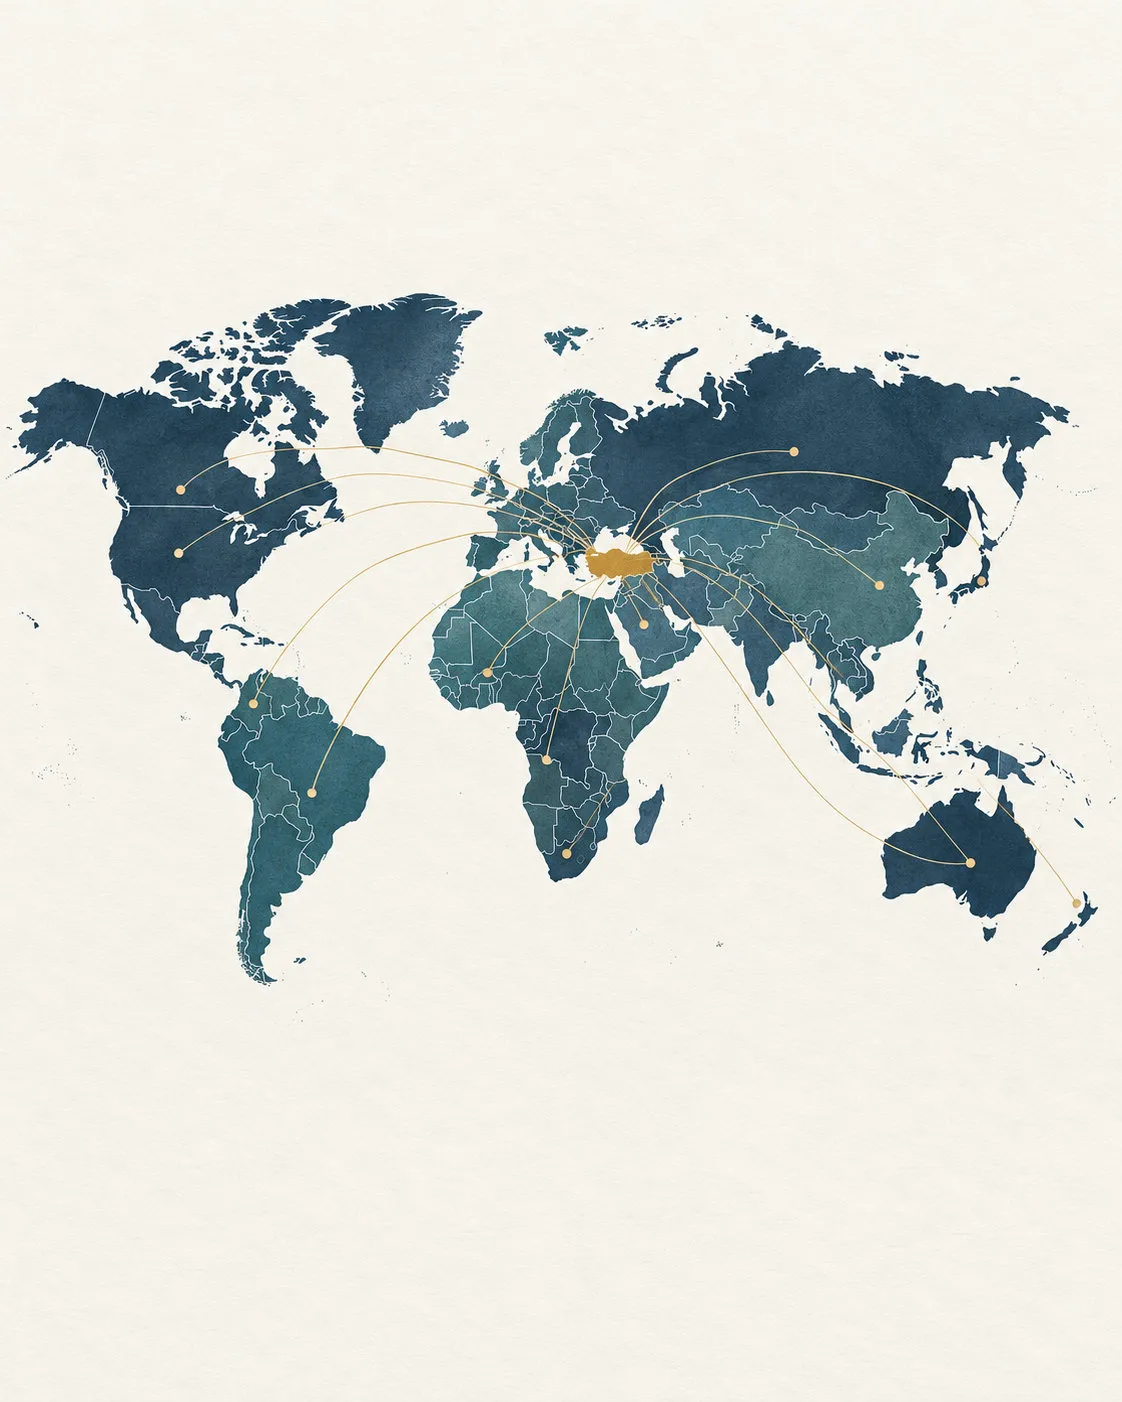
Target Markets | Uzbekistan
Assessment date: 1 November 2026
Aligning healthcare investment with population needs is central to sustainable development. Capacity created through hospitals, beds and medical equipment can deliver lasting health gains when supported by a skilled workforce, sound financing and coordinated care. Drawing on announced reforms and official data, we present recommendations for using Uzbekistan’s existing capacity more effectively and improving the quality of care.
Uzbekistan’s health system transformation should be understood in this context. Measures announced in October 2026 put population-based infrastructure planning, service partnerships with private providers and professional management on the agenda. For Türkiye, this process offers opportunities for mutual capacity development in healthcare delivery, education, hospital management, pharmaceuticals, medical devices and digital health. [5, 6]
Population data as the foundation of health planning
Uzbekistan’s reported population as of 1 January 2026 was approximately 38.24 million. Preliminary census results announced in September 2026 indicated 39.047 million people. The difference should not be interpreted directly as population growth within the same year: census coverage and updated records also contribute to the difference. [1, 2]
| Indicator | Period / description | Figure | Planning relevance |
|---|---|---|---|
| Resident population | 1 January 2026 | 38,236,704 people | Official population at the start of the year |
| Preliminary census result | Announced 2 September 2026 | 39.047 million | Updated planning baseline; preliminary |
| People not covered in earlier statistics | 2026 census announcement | 810,600 people | Reassess service needs and per capita indicators |
Table 1. Sources: National Statistics Committee and Presidency. [1, 2]
Updated population data offer an opportunity to improve the accuracy of health planning. Reviewing regional physician and bed indicators alongside the new population figures can help direct investment towards need. Incorporating age structure, disease burden, settlement patterns and travel time to care would strengthen this approach.
Capacity growth and the scope of services
Official health statistics for 2024 show substantial growth in the number of hospitals, alongside a more modest increase in beds.
| Indicator | 2023 | 2024 | Change |
|---|---|---|---|
| Hospitals | 1,432 | 1,972 | 37.7% increase |
| Hospitals classified as small businesses | 724 | 1,301 | 79.7% increase |
| Hospital beds | 174,500 | 179,900 | Approx. 3.1% increase |
Table 2. Source: Year-end 2024 health statistics. Bed growth was calculated from published rounded values. [3]
The 37.7% increase in hospitals and approximately 3.1% increase in beds describe different dimensions of the service network. Examining facility size, scope of activity and registration methods together would clarify their contribution to service capacity. Changes in quality should be monitored separately through clinical outcomes and patient experience.
Investment assessment should complement facility counts with active beds, occupancy, staffing capacity, operating theatre utilisation, equipment uptime and clinical outcomes.
Differences in regional distribution
According to the official series updated on 19 October 2026, Uzbekistan had 47.6 hospital beds per 10,000 people in 2025. There are substantial differences between regions.
| Region | 2024 beds per 10,000 | 2025 beds per 10,000 |
|---|---|---|
| Uzbekistan | 47.9 | 47.6 |
| Andijan | 48.7 | 50.4 |
| Namangan | 52.7 | 52.3 |
| Fergana | 45.1 | 42.6 |
| Samarkand | 38.0 | 38.5 |
| Kashkadarya | 38.5 | 36.6 |
| Surkhandarya | 34.0 | 34.3 |
| Tashkent city | 86.4 | 83.7 |
Table 3. Source: National Statistics Committee, SIAT; indicator 2.04.07.0109. [4]
The rate in Tashkent city is approximately 2.44 times that in Surkhandarya. However, capital-based centres also treat patients from other regions, which affects ratios calculated using the resident population. The difference alone is therefore insufficient to establish a bed surplus or shortage. Patient flows, referrals, occupancy and travel times should also be considered.
Andijan’s above-average bed capacity provides a foundation for improving the quality of services alongside existing resources. Reviewing specialty-specific needs, the distribution of specialist teams and capacity actually available for use would help establish investment priorities.
Improving the quality and functionality of existing capacity
Uzbekistan reported 47.4 beds per 10,000 people in 2023, equivalent to 4.74 per 1,000. The OECD average for the same year was 4.2 per 1,000. Uzbekistan’s figure was approximately 13% higher. Differences in definitions and coverage must be considered. This comparison alone does not establish a national bed surplus; it supports assessing capacity decisions alongside quality, utilisation and regional needs. [4, 10]
We recommend prioritising bed and care quality where existing capacity is sufficient. A high-quality bed represents care capacity supported by an appropriate physical environment, privacy, infection prevention, necessary monitoring and oxygen infrastructure, trained teams and continuity of care. Developing these elements together would increase the benefit patients receive from existing investment.
Before adding beds, planners should examine active capacity by specialty, occupancy, average length of stay, avoidable admissions and waiting times. Additional capacity should be developed where need is demonstrated; elsewhere, modernisation, day treatment, rehabilitation and home care should be considered. Using bed occupancy alone as a performance target could encourage unnecessary admissions.
Financial sustainability and financial protection for patients
Historical data in the 2024 report by WHO and the European Observatory on Health Systems and Policies help explain the financial protection dimension of reform.
| Indicator | Data year | Value | Assessment |
|---|---|---|---|
| Out-of-pocket share of health expenditure | 2021 | 60.3% | High direct payment burden on households |
| Central Asian average for the same indicator | 2021 | 53.6% | Uzbekistan is 6.7 percentage points higher |
| Share of spending on medical goods, mainly medicines | 2019 | 35.7% | Access to medicines and rational use matter |
| Share of spending on preventive services | 2019 | 3% | Review resources allocated to prevention |
| Out-of-pocket share of current health expenditure | 2023 | Approx. 64% | WHO data cited in the 2026 ILO statement |
Table 4. Sources: Health Systems in Action: Uzbekistan, 2024, and ILO, 11 September 2026. Data years differ; these are not expenditure figures for 2026. [7, 9]
A more recent assessment appears in the ILO statement dated 11 September 2026. Citing the WHO Global Health Expenditure Database, it reports that out-of-pocket payments accounted for approximately 64% of current health expenditure in 2023. This indicates a continuing financial protection challenge. Before calculating an exact change from the earlier report’s 2021 figure, the same updated data series and any revisions should be checked. [9]
The out-of-pocket share alone does not show how many people forgo treatment. Answering that question requires monitoring payment burdens by income group, unmet healthcare needs and impoverishing health expenditure.
Health budget increases should also be assessed beyond nominal amounts. Real per capita resource changes should be calculated after considering inflation, population and service coverage. Their effects on waiting times, access to medicines and treatment outcomes should then be examined.
Strengthening service capacity through insurance financing
Our field observations highlight the importance of considering public hospitals’ revenue structures alongside their public service responsibilities. Coordinated planning of paid-service income, budget allocations and insurance payments can support financial stability, timely treatment and access to care.
The State Health Insurance Fund’s role in purchasing services under the guaranteed benefit package is an important instrument for improving financial protection. The ILO’s September 2026 statement notes that nationwide coverage is expected by the end of 2026. As this objective is implemented, we recommend ensuring that reimbursement arrangements adequately reflect public hospitals’ workloads and costs. [9]
Regular comparisons between reimbursement tariffs and case costs, predictable payment schedules and transparent explanations of deductions can strengthen hospitals’ financial planning. Monitoring case-mix-adjusted tariff–cost gaps, payment times and additional patient charges across public and private providers would be valuable. Explicit financing of public hospitals’ emergency, teaching and continuous readiness responsibilities would support the system as a whole.
Bringing public and private providers’ experience together around shared quality objectives can improve service organisation and resource use. Private providers’ service development and management capabilities can complement public institutions’ broad coverage, teaching and advanced care responsibilities. Common purchasing criteria based on need, verified quality, access and cost would make the public benefit of this cooperation more visible.
The October 2026 agenda and changes in management
Recent announcements address how services are managed alongside infrastructure investment.
| Announcement | Figures / direction | Status |
|---|---|---|
| 26 October: Infrastructure | Regional master plans for 2026–2036 | Planning approach under consideration |
| Distribution in Samarkand | Districts: 80% of population, 41.7% of beds; bed-share target 67% | Current situation and target are distinct |
| 28 October: Investment portfolio | 35 projects; USD 2.7 billion | Portfolio, not realised expenditure |
| Additional project proposals | 9 projects; USD 1 billion | Proposals; some at conceptual stage |
| Outsourcing | 30% share of healthcare procurement by 2030 | Future target |
| Professional management | Five major healthcare institutions by 2030 | Planned implementation |
Table 5. Source: Presidency, 26 and 28 October 2026. Project amounts at different stages should not be added together as completed investment. [5, 6]
The management implication is that investment decisions should be prepared together with operating plans. Staffing, consumables, maintenance budgets, referral networks and reimbursement arrangements should be defined before a new centre opens. Service contracts should include quality, continuity and patient safety criteria alongside activity volumes.
New measures for the workforce and access to care
The official statement of 27 October 2026 envisages expanded access to medicines and professional training.
| Area | Announced information | Outcome to monitor |
|---|---|---|
| Free medicines | 69 types for outpatients under the pilot model; target of 73 for 2027 | Availability and patient payment burden |
| Expansion of the model | 100 additional districts in 2027 | Effective service coverage and access |
| Medical education | Reportedly 15,000 doctors trained annually at 11 state universities | Employment and regional distribution |
| Residency training | Free training announced from 2027 | Competent staff in priority specialties |
| Regional team training | Three- to four-month internships at specialised centres | Transfer of training into clinical practice |
Table 6. Source: Official statement of 27 October 2026. Items referring to future years are announced plans. [8]
Translating educational capacity into services requires assessment beyond graduate numbers. The competencies of nurses, technicians, biomedical specialists and health managers matter alongside those of physicians. Training should be evaluated through the application of acquired skills and changes in clinical outcomes.
Pay and performance linked to quality
WHO’s 2024 assessment identifies pay levels and the regional distribution of healthcare workers as areas for improvement. Considering adequate base pay together with professional development and working conditions can support retention and continuity of care. A performance model that rewards measurable contributions would make staff effort more visible. [7]
Previously announced achievement-based bonuses and staff support measures on the October 2026 agenda provide a basis for developing performance management. Transparent, fair and consistent implementation can be supported by shared indicators of clinical quality and team contribution. [8, 11]
We recommend linking performance payments to clinical outcomes, patient safety, appropriate resource use, access and team contribution alongside activity volumes. Contributions by physicians, nurses and support teams should be recognised, with case complexity and available institutional resources considered in assessment. Including quality and clinical appropriateness would better align incentives with patients’ actual needs.
Implementation should first be piloted in selected units with baseline measurement. Indicators, audit procedures and an appeals mechanism should be shared with staff. Patient satisfaction is an important component and should be used alongside clinical quality and safety measures. The objective is to achieve better, sustainable health outcomes with available resources before pursuing higher procedure volumes.
Coordination across primary secondary and tertiary care
The system can be planned as a network in which primary care encompasses family medicine, outpatient and community-based services; secondary care provides general specialist and hospital services; and tertiary care covers advanced specialties, complex treatment and referral centres. Strengthening prevention and chronic disease follow-up in primary care would help hospitals focus on services requiring specialist expertise.
Each level should have a defined scope of services, referral criteria and responsibilities for returning patients to ongoing care. Shared patient records, access to test results and coordinated appointments may reduce duplicate testing, unnecessary higher-level consultations and loss to follow-up. These expectations should be assessed after implementation through repeat-test rates, referral appropriateness and time to treatment.
Planning equipment around each level’s functions and needs can improve resource use. Primary care can be supported with basic diagnostic and monitoring tools, secondary care with imaging and treatment capacity appropriate to its service scope, and tertiary care with advanced technology and specialist teams. Shared laboratory, imaging and sterilisation services may improve resource use where transport, turnaround time and emergency access requirements are met. [5]
Equipment procurement should include budgets for training, maintenance, calibration, consumables and spare parts. Successful coordination should be assessed by whether patients receive safe care at the appropriate level and reach necessary higher-level treatment without delay, rather than by reducing referral numbers alone.
Moving from data to quality through meaningful indicators
The following framework is the author’s management proposal; it does not report current national outcomes.
| Area | Volume / resource indicator | Quality and sustainability indicator |
|---|---|---|
| Outpatient care | Visits and unique patients | Waiting time, appropriate referrals, continuity |
| Surgery | Operations and theatre utilisation | Risk-adjusted complications, readmissions, case cost |
| Chronic diseases | Registered and monitored patients | Disease control, medicine continuity, avoidable admissions |
| Imaging | Tests and equipment capacity | Appropriate requests, reporting time, equipment uptime |
| Financing | Revenue and expenditure | Case cost, collection time, patient payment burden |
| Workforce | Staffing and training | Competency, workload, turnover |
| Medical tourism | Unique international patients and revenue | Clinical outcomes, follow-up, total cost, net contribution |
Table 7. Management and monitoring framework proposed by the author.
These indicators should use common definitions, with clinical and financial records securely linked. Comparisons between institutions should account for patient profiles and disease severity. Without baseline measurement and an appropriate comparison, improvement should not be attributed solely to a new intervention.
Developing service capacity together with Türkiye
Cooperation with Türkiye can be organised around programmes that respond to Uzbekistan’s identified needs.
| Cooperation area | Practical application | Measure of success |
|---|---|---|
| Clinical training | Joint teams and training of trainers | Local teams able to deliver care independently |
| Hospital management | Capacity, cost and quality management | Efficiency gains while maintaining access and outcomes |
| Pharmaceuticals and medical devices | Supply, maintenance and local capacity | Uninterrupted access and total cost of use |
| Digital health | Integrated clinical and financial data | Better record quality and decision-making |
| International patients | Appropriate referrals and shared follow-up | Treatment outcomes, continuity and net contribution |
Table 8. Cooperation and evaluation framework proposed by the author.
Medical tourism reporting should distinguish unique patients, repeat visits, country of residence, purpose of travel and specialty. Moving from gross revenue to economic contribution requires accounting for treatment, intermediary, promotion and follow-up costs. Revenue from pharmaceuticals and medical device trade, training and consultancy should be reported separately.
Uzbekistan’s announced reforms establish an important agenda for translating healthcare investment into high-quality, accessible services. Improving existing bed and care capacity, supporting staff through fair pay and quality-based performance incentives, coordinating levels of care and aligning insurance financing with service costs can strengthen this process. Mutual learning and joint initiatives with Türkiye can also contribute to local team development, financial protection for patients and measurable health gains.
References
[1] National Statistics Committee. Resident population announcement for 1 January 2026.
https://stat.uz/en/press-center/news-of-committee/66574-zbekiston-a-olisi-38-2-mlndan-oshdi-4
[2] Presidency of Uzbekistan. New data management model to be introduced in the national statistical system. 2 September 2026.
https://president.uz/en/lists/view/9573
[3] National Statistics Committee. Healthcare in the Republic of Uzbekistan, year-end 2024.
https://stat.uz/img/images/healthcare_p40170.pdf
[4] National Statistics Committee. SIAT, Number of hospital beds per 10 000 population, code 2.04.07.0109; updated 19 October 2026.
https://siat.stat.uz/data/3194/?lang=en
[5] Presidency of Uzbekistan. Review of healthcare infrastructure development and expanded private sector participation. 26 October 2026.
https://www.president.uz/ru/lists/view/9782
[6] Presidency of Uzbekistan. President Reviews Progress of Major Healthcare Investment Projects. 28 October 2026.
https://www.president.uz/en/lists/view/9788
[7] WHO / European Observatory on Health Systems and Policies. Health Systems in Action: Uzbekistan, 2024.
https://eurohealthobservatory.who.int/publications/i/health-systems-in-action-uzbekistan-2024
[8] Government portal of Uzbekistan. New healthcare standards to be introduced, support for doctors to be strengthened. 27 October 2026.
https://gov.uz/en/digital/news/view/238940
[9] ILO. Uzbekistan takes stock of progress and outlines next steps towards universal health coverage. 11 September 2026. https://www.ilo.org/resource/news/uzbekistan-takes-stock-progress-and-outlines-next-steps-towards-universal
[10] OECD. Health at a Glance 2025, Hospital beds and occupancy. Data for 2023. https://www.oecd.org/en/publications/health-at-a-glance-2025_8f9e3f98-en/full-report/hospital-beds-and-occupancy_152d839e.html
[11] Embassy of Uzbekistan in the United Kingdom. Salaries of medical workers in Uzbekistan to increase from June 1. Statement on pay and incentive measures in 2022. https://www.uzembassy.uk/news/842
Methodological note: Field assessments reflect the author’s observations and are not presented as nationally representative research findings. Policy proposals are distinguished from official statistics and observed implementation outcomes.
Sources accessed and assessed on 1 November 2026. Years shown in tables refer to the relevant data periods. Calculated changes may reflect rounding. Policy announcements should not be interpreted as implementation outcomes.
Back to all articles